

Turn your current state complexity into opportunity.
Use your existing data to create an accurate representation of your organisations technical blueprint.
Re-calibrate your perspectives to provide situational awareness to your design, build and support teams.
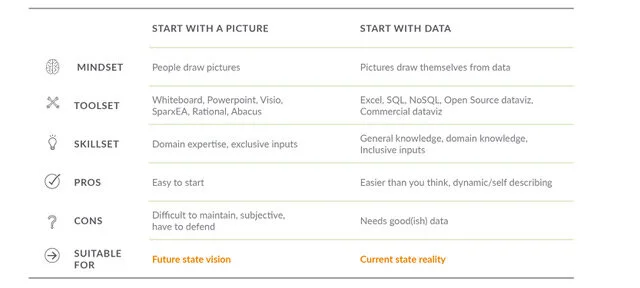
Starting with data offers an alternative, especially when it comes to understanding current state complexity.
HubScope reveals inter-dependencies by visualising your ICT landscape.
ICT has become a complicated and adaptive system, a system of systems which are independent yet highly interdependent. The whole is more than the sum of the parts. ICT systems are not magic, but they are sometimes hard to fathom especially when they have been extended and enhanced over many years and can really only be truly understood by breaking interdependent components down into a number of layers.
Visualising your current state ICT system using your existing data provides a much better understanding of as-is and to-be states that can be acted upon by providing trustworthy insights into the dynamics of the changing system.
Visualisation by itself does not provide any inherent ability to predict how your system might behave, but it does give you great insights into how the system currently works and just as important, how it can be changed to behave differently.
Knowing how your ICT system of systems works at different layers is a very valuable approach especially when something needs to be changed, moved or replaced.
See below to hear what our clients have to say, this is followed by an interview with our CEO about the vision that led to the design and build of HubScope.
We look forward to working with you to untangle your current state complexity.
Calculate and mitigate potential operational risks.

“This directly mitigates risk across our deployments. I mean, that’s a huge shift”.
Rochelle Kerr, Integration Architect, Datacom.
2. Breakdown conflicting responses and perspectives when solving a problem.

“I can communicate technical complexity and facts, visually. I find humans connect more deeply to that”.
Steve Clarke, Data Architect, Ministry of Justice.
3. Understand connections and inter-dependencies using a data driven visualisation and exploration platform.

“Relationships and connections are an important part of how we see the world, and how we frame up solutions”.
Steve Dickinson, CEO, Hubscope.
